

Oh… hey! Thank you all for your patience on my long hiatus, but I think I’m back??? Look out for more emails from me soon.
This summer, the Williamsburg-James City County school division conducted a survey from May 12 to June 7 about its ongoing redistricting process, an effort to redraw the boundary lines of school zones to address capacity concerns.
The division published the redacted survey results on June 29, 2026 as a 3,106 page PDF. The survey consists of both multiple choice questions as well as ones that asked for written responses.
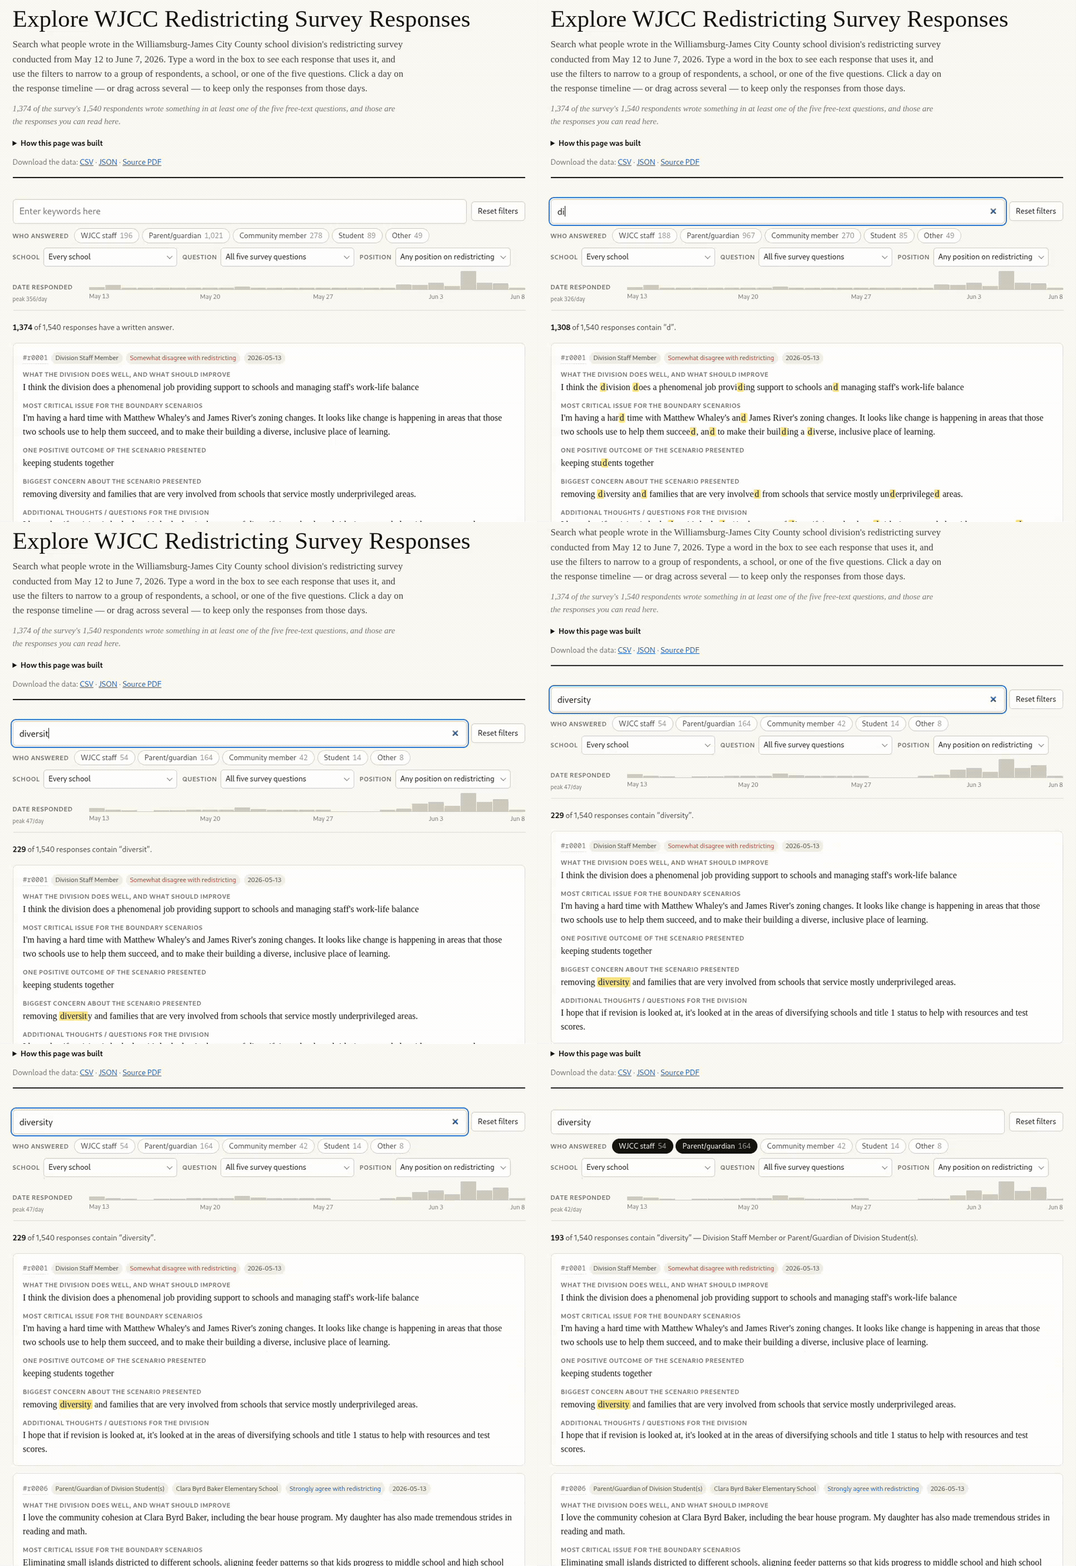
To make the written response results easier to review, I used Claude Code to convert the survey responses into an interactive web page. Try it out for yourself by clicking the button below, or read on to learn how it works and how to use it.
How it works
The page lists all 1,374 survey submissions with written responses, and each entry shows who answered (Staff, parent, etc.), their position on redistricting (agree/disagree), and the date they responded.
You can search responses by keywords, such as “diversity”, “Ford’s Colony”, etc. You can filter the responses by respondent category (Staff, parent, etc.), their school affiliation, and their position on redistricting. You can also narrow down responses by date or range of dates by clicking and dragging on the timeline filter.
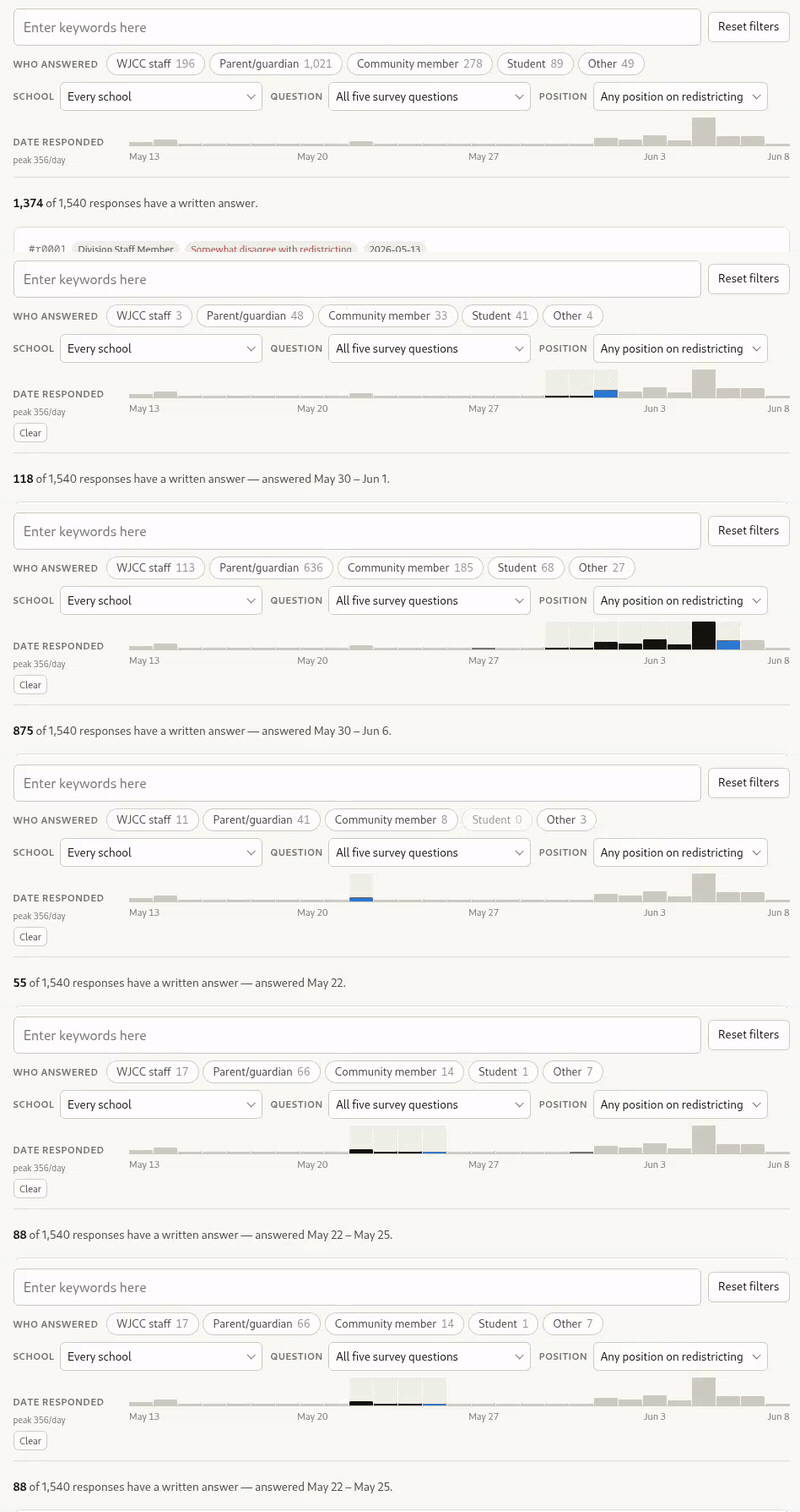
You can also download the data yourself as the original PDF or a CSV or JSON file. I’ve also written a blog post explaining how I created the page if you’d like to take a crack at something similar yourself.
Where to begin?
It can be a little overwhelming to dive in and navigate 1,374 survey responses, even with a slick interactive web page. To help, I’ve produced some charts based on the survey results to help get you started.
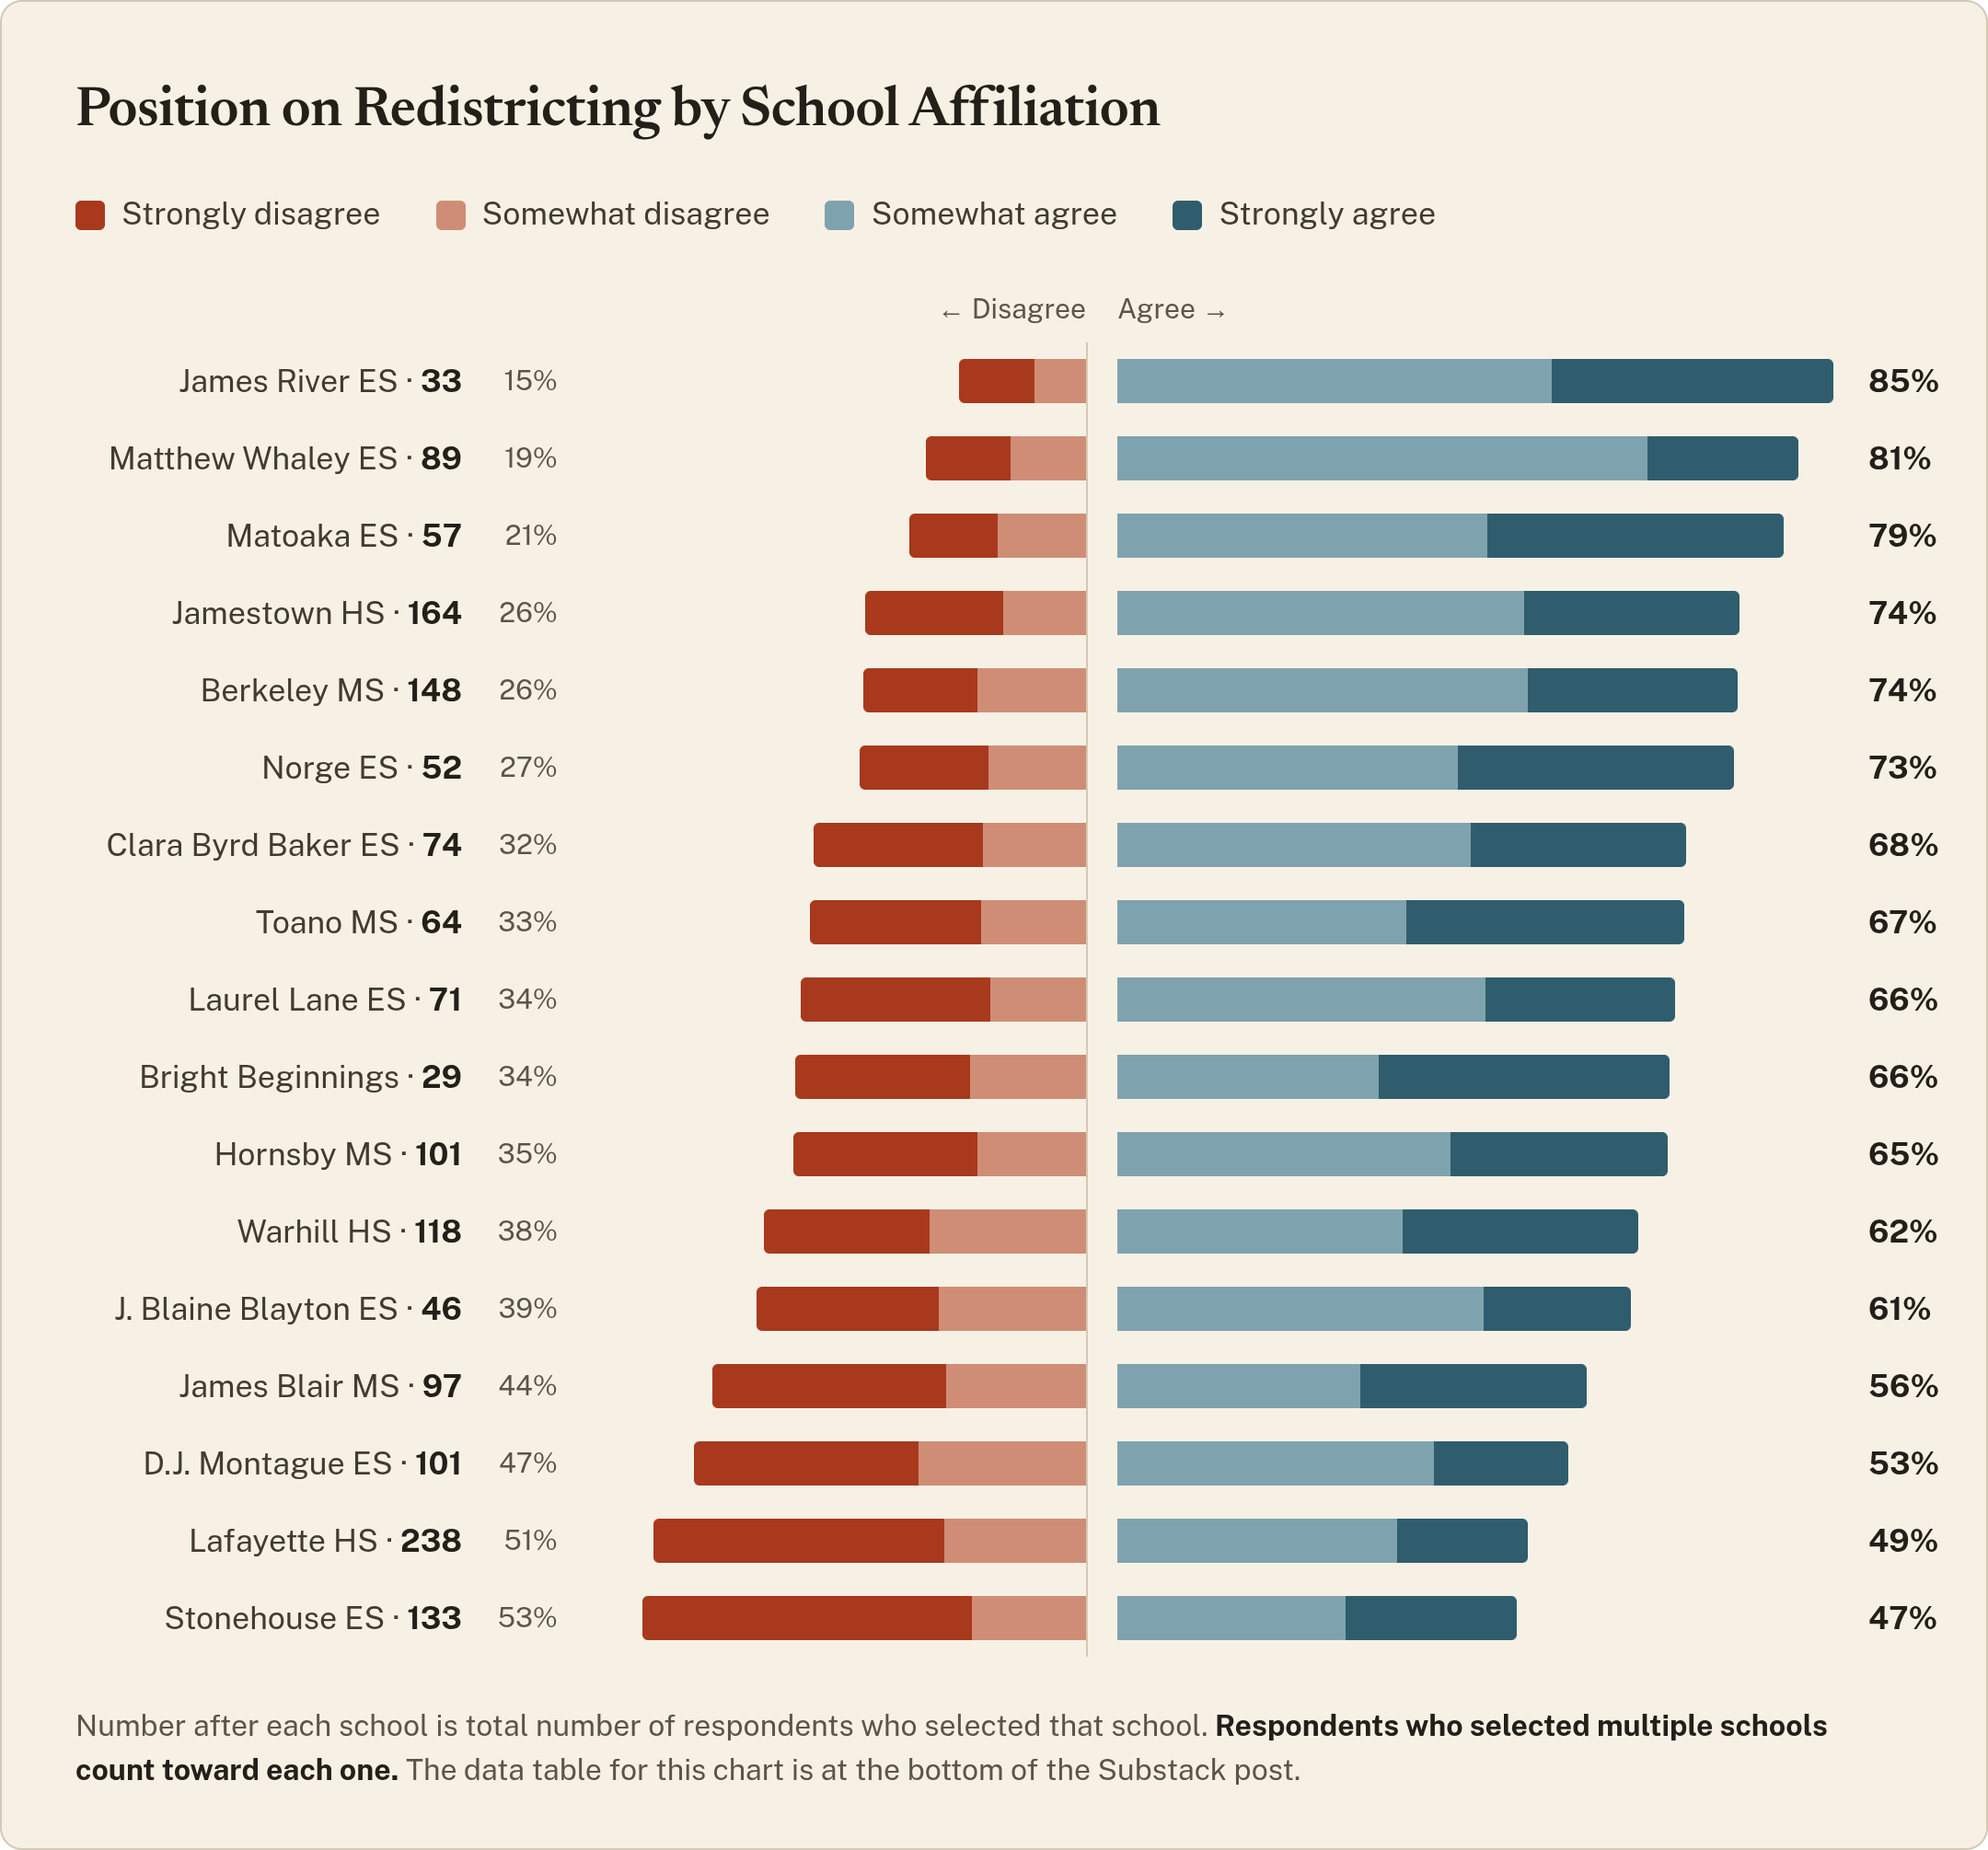
First let’s look at which school affiliations (keeping in mind respondents could pick more than one) and see how those correlate with positions on redistricting. We can see from the chart that the group who selected Stonehouse Elementary as their school had the most opponents to the school division’s plans.
If we select “Stonehouse ES” from the school dropdown menu on the survey explorer page, we can see all responses that selected that school in their survey submission. We can filter further by selecting “Strongly disagree” from the position dropdown menu.
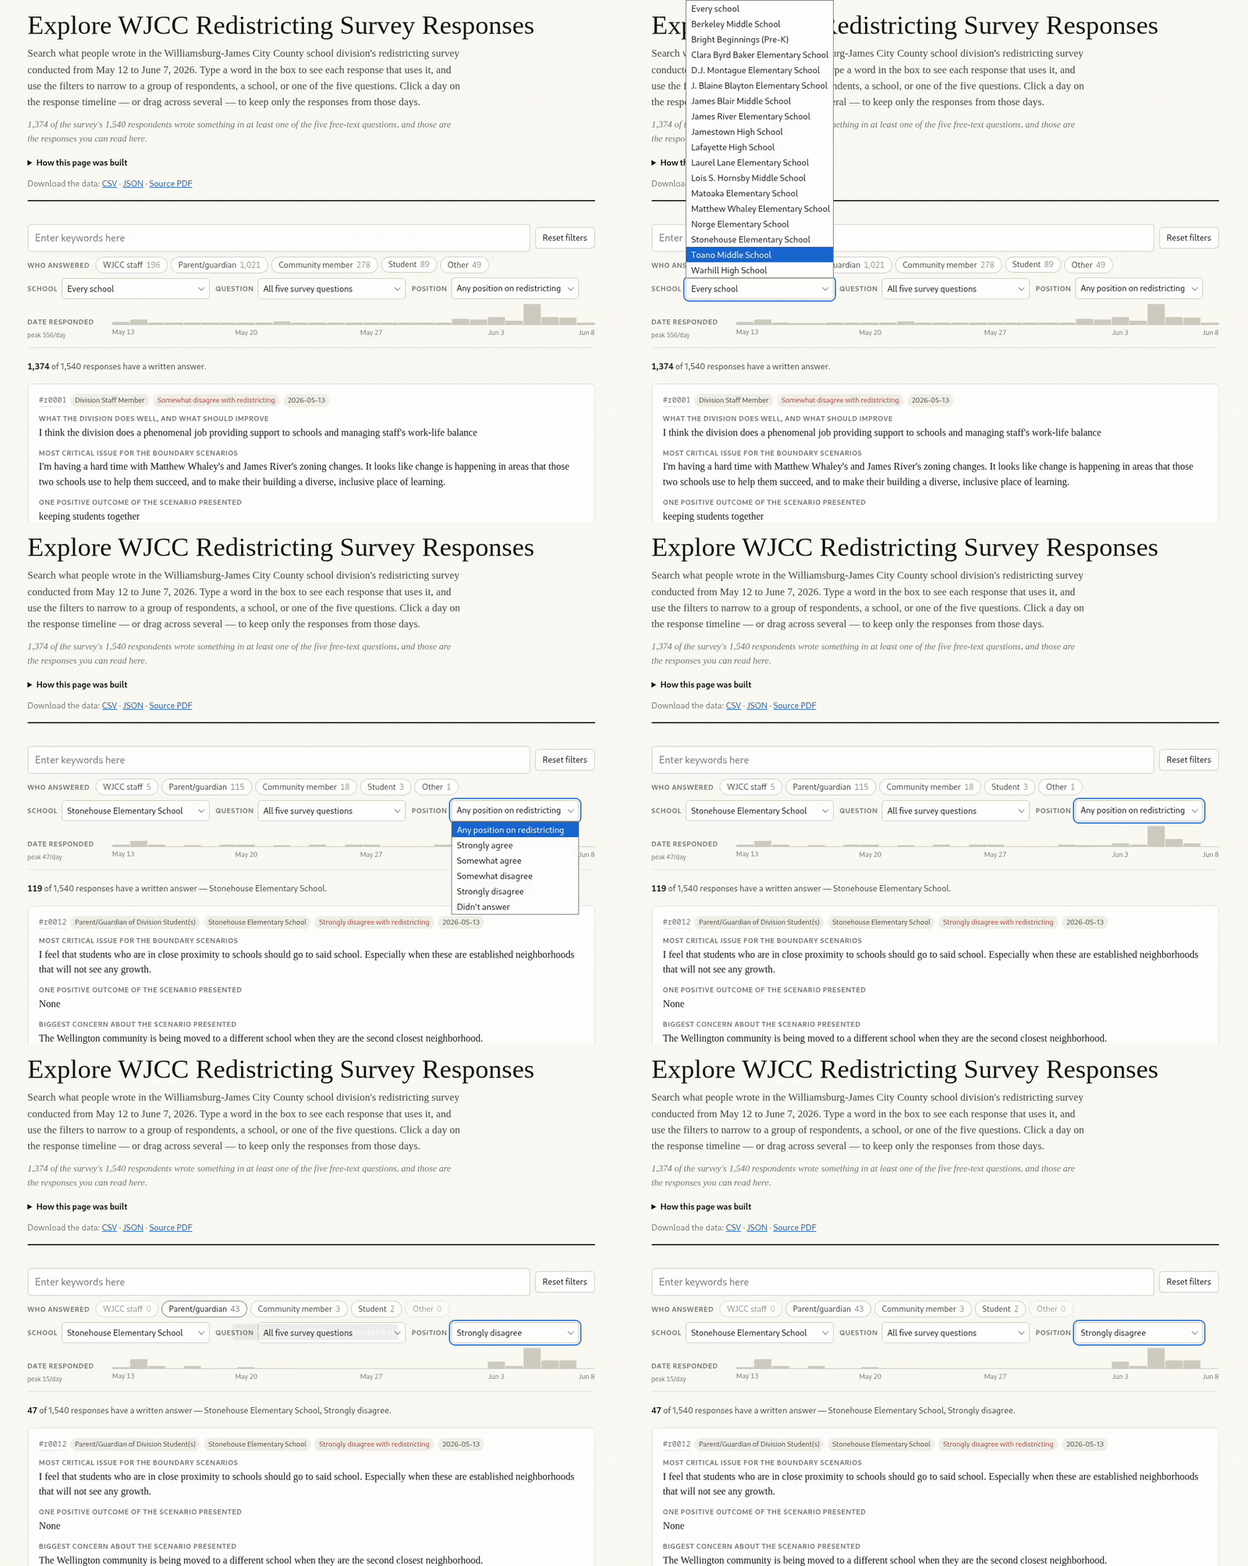
We can see in the numbers next to the “Who Answered” buttons, which update as you filter, that the vast majority of respondents who strongly disagree with redistricting and are affiliated with Stonehouse ES are parents/guardians.
“This is not fair to the kids currently in the affected areas, nor their parents that purchased homes with the expectation that they will go to a particular school.” - Respondent #99, self-identified Parent of Stonehouse ES student.
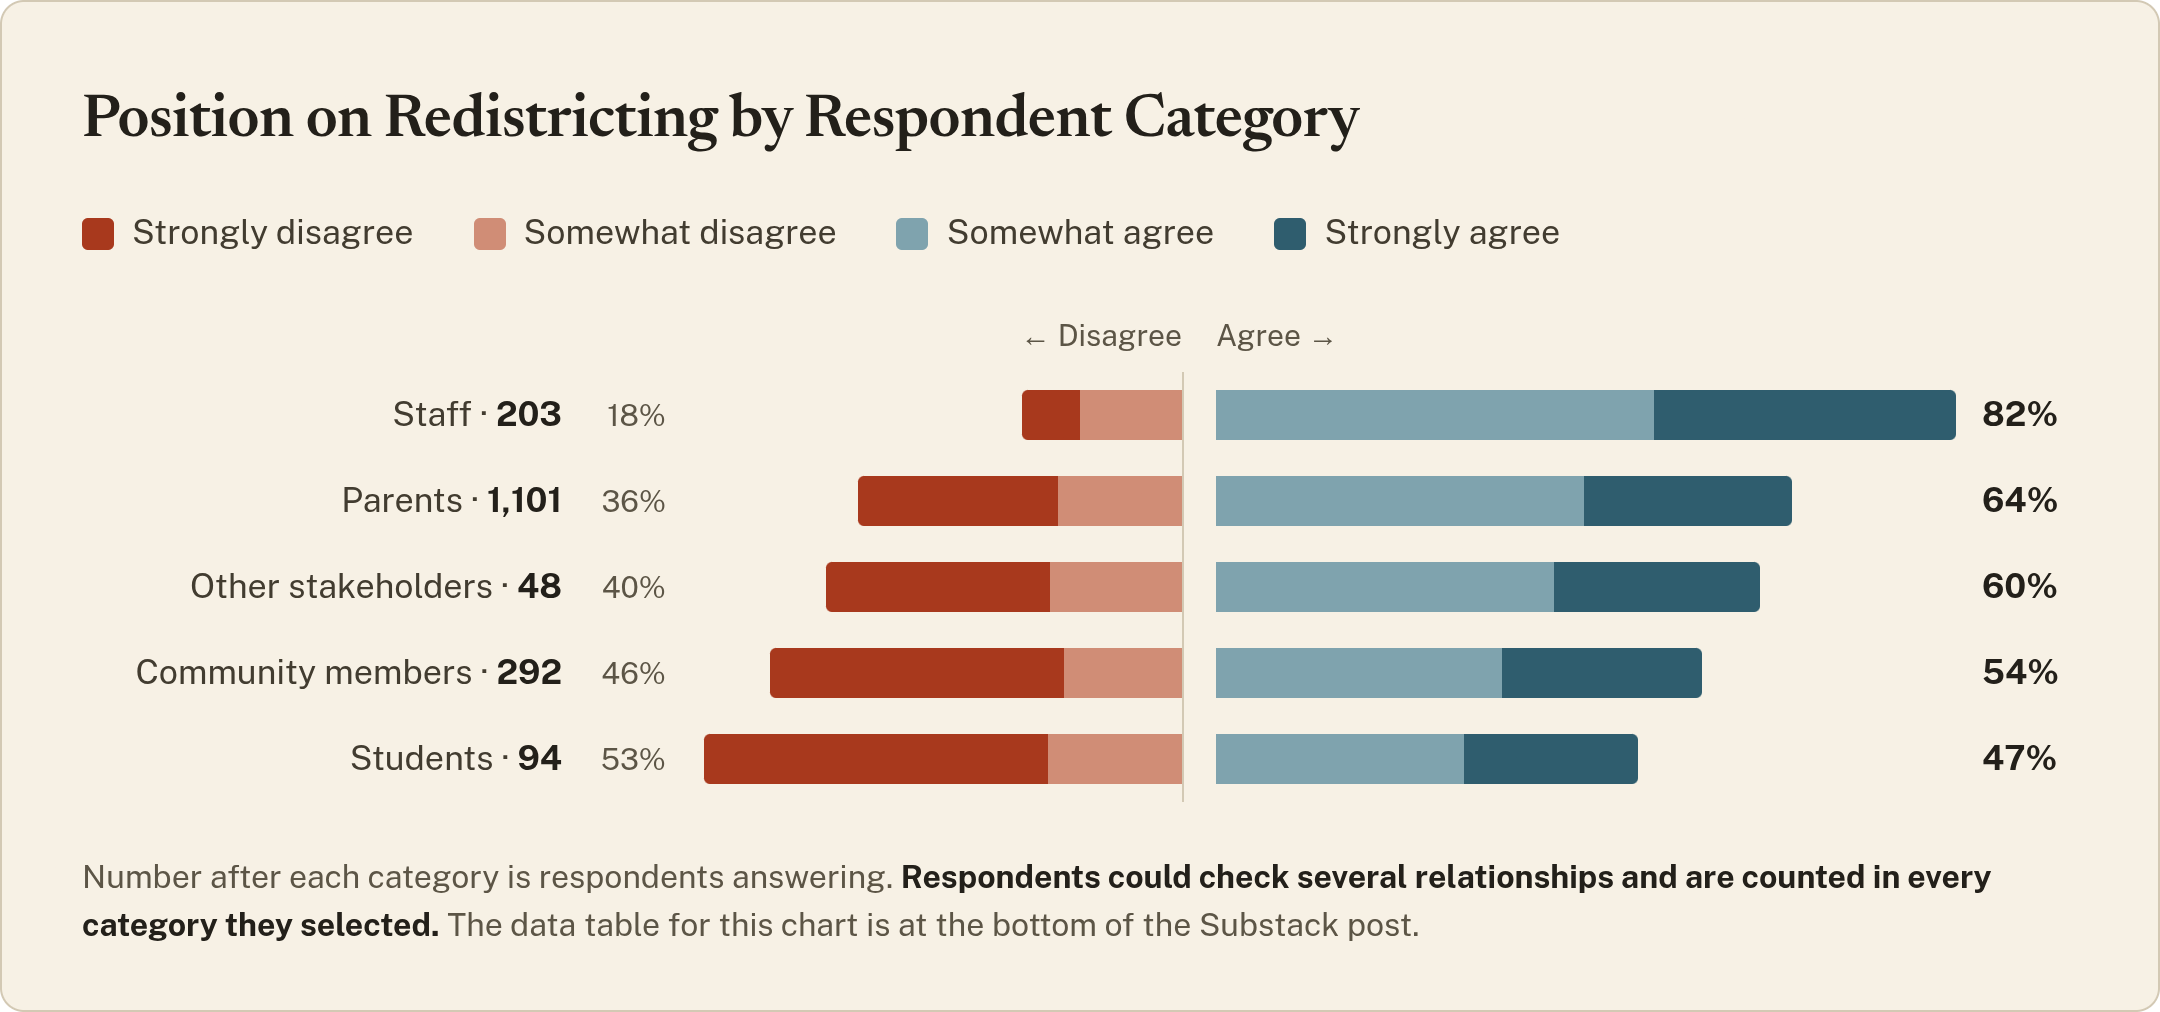
Despite the Stonehouse case, if we look at respondent categories across the survey results, we see that “Students” as a group have the highest percentage of opponents to redistricting (53%), noting that the total number of student respondents is less than a tenth of total “Parent” respondents (94 vs 1,101).
So what schools are the student respondents from? If we click the Students “Who Answered” filter and select “Strongly Disagree” from the position dropdown, we can see that some students did not disclose their school affiliation, but for those that did one name jumps out: Lafayette High School. If we filter by that school, we can see in the updated timeline that the majority of them filled out the survey on the same day, June 1.
“I believe that I should be able to graduate in the high school that I went to for 3 years. I have contributed to my community here at Lafayette High School, I have made friends, participated in multiple athletics, been part of a team… It is truly unfair to redistrict students who are in the last year of their high school careers.” - Respondent #445, self-identified Lafayette High School student.
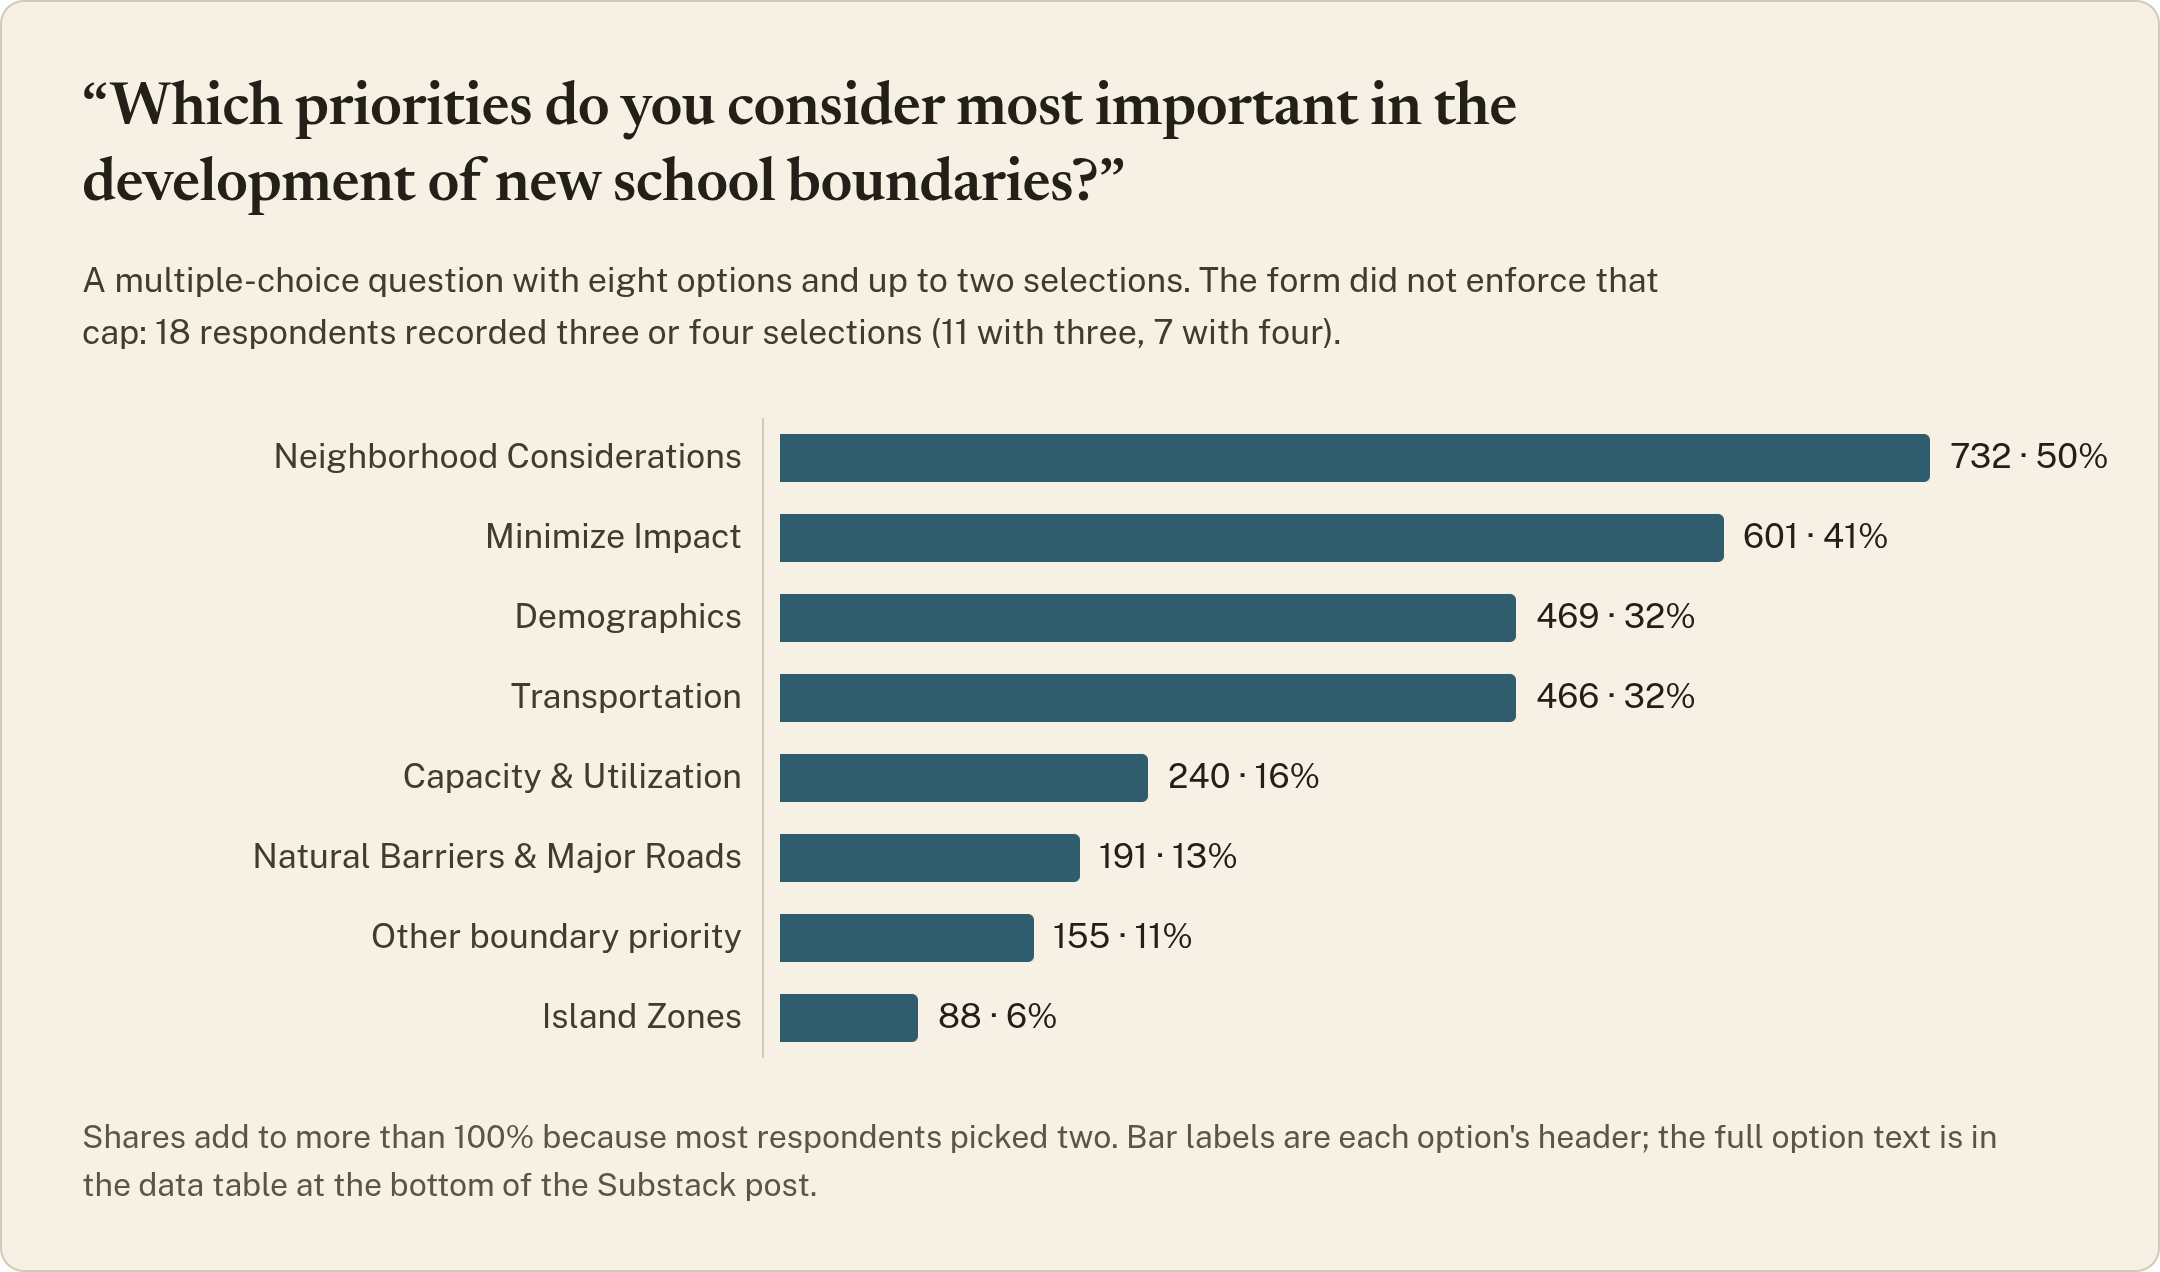
Finally, if we look at how respondents answered one multiple choice survey question about their redistricting priorities, we can see that 732 of them selected “Neighborhood Considerations– Keep neighborhoods together as much as possible, avoid splitting down the middle of the street.”
Another popular priority was “Demographics - Consider racial and ethnic diversity as well as socio-economic indicators within schools.” If we search “diversity” in the survey explorer page, we can see that 229 responses mentioned that term.
We can filter further by going to the “Question” dropdown menu and selecting the “Biggest concern” option. If we go through the redistricting positions, we can see that diversity was mentioned as a concern more by responses who either somewhat agreed or strongly agreed with redistricting (53) than those who somewhat or strongly disagreed (22).
“You’ve cut the diversity down it seems. Kings Mill and Ford’s Colony, both ‘affluent’ neighborhoods are now going to ‘preferred’ schools it seems. The lower income sections of town are staying at the schools with tougher reputations.” - Respondent #75, “Strongly Agreed” with redistricting.
What’s Next
I hope these examples spark your curiosity. If you find anything interesting as you explore the results (or any bugs/errors), please let me know!
You may have noticed the branding for this newsletter has changed. Round the Triangle is now Track the Triangle. Read more at the updated About page.
My plan is to bring back the WJCC school board meeting recaps this month. Stay tuned!
Data from charts
POSITION ON REDISTRICTING BY SCHOOL AFFILIATION
Respondents who selected multiple schools count toward each one, so these groups sum to more than the 1,470 people who answered the question.
James River ES: 85% agree, 15% disagree, of 33 answering (11 strongly agree, 17 somewhat agree, 2 somewhat disagree, 3 strongly disagree)
Matthew Whaley ES: 81% agree, 19% disagree, of 89 answering (16 strongly agree, 56 somewhat agree, 8 somewhat disagree, 9 strongly disagree)
Matoaka ES: 79% agree, 21% disagree, of 57 answering (20 strongly agree, 25 somewhat agree, 6 somewhat disagree, 6 strongly disagree)
Jamestown HS: 74% agree, 26% disagree, of 164 answering (42 strongly agree, 79 somewhat agree, 16 somewhat disagree, 27 strongly disagree)
Berkeley MS: 74% agree, 26% disagree, of 148 answering (37 strongly agree, 72 somewhat agree, 19 somewhat disagree, 20 strongly disagree)
Norge ES: 73% agree, 27% disagree, of 52 answering (17 strongly agree, 21 somewhat agree, 6 somewhat disagree, 8 strongly disagree)
Clara Byrd Baker ES: 68% agree, 32% disagree, of 74 answering (19 strongly agree, 31 somewhat agree, 9 somewhat disagree, 15 strongly disagree)
Toano MS: 67% agree, 33% disagree, of 64 answering (21 strongly agree, 22 somewhat agree, 8 somewhat disagree, 13 strongly disagree)
Laurel Lane ES: 66% agree, 34% disagree, of 71 answering (16 strongly agree, 31 somewhat agree, 8 somewhat disagree, 16 strongly disagree)
Bright Beginnings: 66% agree, 34% disagree, of 29 answering (10 strongly agree, 9 somewhat agree, 4 somewhat disagree, 6 strongly disagree)
Hornsby MS: 65% agree, 35% disagree, of 101 answering (26 strongly agree, 40 somewhat agree, 13 somewhat disagree, 22 strongly disagree)
Warhill HS: 62% agree, 38% disagree, of 118 answering (33 strongly agree, 40 somewhat agree, 22 somewhat disagree, 23 strongly disagree)
J. Blaine Blayton ES: 61% agree, 39% disagree, of 46 answering (8 strongly agree, 20 somewhat agree, 8 somewhat disagree, 10 strongly disagree)
James Blair MS: 56% agree, 44% disagree, of 97 answering (26 strongly agree, 28 somewhat agree, 16 somewhat disagree, 27 strongly disagree)
D.J. Montague ES: 53% agree, 47% disagree, of 101 answering (16 strongly agree, 38 somewhat agree, 20 somewhat disagree, 27 strongly disagree)
Lafayette HS: 49% agree, 51% disagree, of 238 answering (37 strongly agree, 79 somewhat agree, 40 somewhat disagree, 82 strongly disagree)
Stonehouse ES: 47% agree, 53% disagree, of 133 answering (27 strongly agree, 36 somewhat agree, 18 somewhat disagree, 52 strongly disagree)
POSITION ON REDISTRICTING BY RESPONDENT CATEGORY
The relationship question was check-all-that-apply, so respondents are counted in every category they selected; these groups total 1,738 against 1,470 answering.
Staff: 82% agree, 18% disagree, of 203 answering (68 strongly agree, 99 somewhat agree, 23 somewhat disagree, 13 strongly disagree)
Parents: 64% agree, 36% disagree, of 1,101 answering (256 strongly agree, 449 somewhat agree, 152 somewhat disagree, 244 strongly disagree)
Other stakeholders: 60% agree, 40% disagree, of 48 answering (11 strongly agree, 18 somewhat agree, 7 somewhat disagree, 12 strongly disagree)
Community members: 54% agree, 46% disagree, of 292 answering (65 strongly agree, 93 somewhat agree, 38 somewhat disagree, 96 strongly disagree)
Students: 47% agree, 53% disagree, of 94 answering (18 strongly agree, 26 somewhat agree, 14 somewhat disagree, 36 strongly disagree)
MOST IMPORTANT PRIORITIES IN DEVELOPING NEW SCHOOL BOUNDARIES
Shares are of the 1,466 who answered. They add to more than 100% because respondents could pick up to two; the form did not enforce the cap, and 18 respondents recorded three or four selections (11 with three, 7 with four).
Neighborhood Considerations: 732 respondents, 50%
Minimize Impact: 601 respondents, 41%
Demographics: 469 respondents, 32%
Transportation: 466 respondents, 32%
Capacity & Utilization: 240 respondents, 16%
Natural Barriers & Major Roads: 191 respondents, 13%
Other boundary priority: 155 respondents, 11%
Island Zones: 88 respondents, 6%
Full option text as it appeared in the survey:
Neighborhood Considerations – Keep neighborhoods together as much as possible, avoid splitting down the middle of the street.
Minimize Impact – Move the fewest number of students to accomplish the boundary adjustment, set long term boundaries (10-12 years) accounting for known enrollment variations
Demographics – Consider racial and ethnic diversity as well as socio-economic indicators within schools.
Transportation – Minimize time on bus, logical safe stops for group pickups, efficiency with time and dollars
Capacity & Utilization – Optimizing the use of school facilities to match current and projected enrollment balancing utilization at the current, 5-year, and 10-year forecasted trends.
Natural Barriers & Major Roads – Use natural barriers and major roads to create efficiency in setting boundaries and keeping neighborhoods together.
Island Zones – consider known enrollment variations and population projections in setting boundaries, avoid current and future islands